Accessing Query Window in Sumo Logic
Posted
Last updated
Sumo Logic is a hosted log management solution. I like their service because they provide a powerful query language. It isn’t quite as powerful as SQL but you can do a lot of analysis that would be difficult in simpler search tools.
From time to time however it would be useful for a search to know the time window that it is working on. I have searched around but I wasn’t be able to find any built-in fields or operators that reveal the query window. Luckily I have found one operator that accidentally reveals this information.
| timeslice 1 buckets
This will provide the window start as _timeslice and the window end as __timeslice_end.
You can also alias the names for better clarity.
| timeslice 1 buckets as query_window_start
| __timeslice_end as query_window_end
| query_window_end - query_window_start as query_window_duration
Use Cases
Unaligned timeslice
The built in timeslice operator is very useful however it globally aligns buckets. This means that the latest bucket is probably only partly full. For example if you run timeslice 7d on Monday you will only have a day and a half worth of data (since Sumo Logic assumes that weeks start on Sunday). Similarly if you run timeslice 1d at noon the last day will only have the morning’s data. This can be confusing and isn’t always desirable.
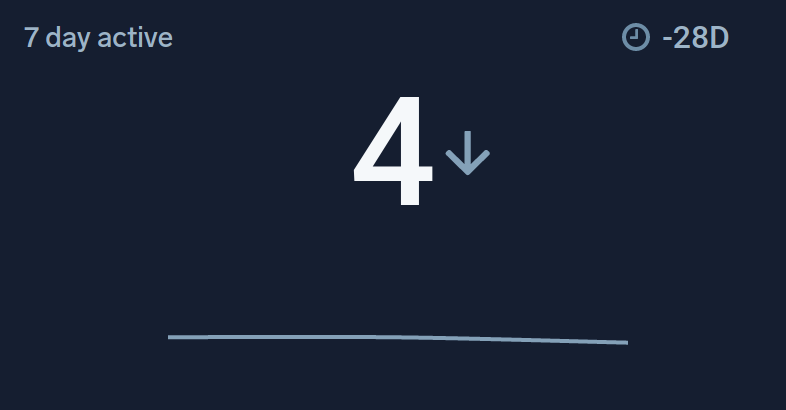
For example I wanted to graph “weekly active users”. Unfortunately I don’t think it is possible to generate this as a daily graph in Sumo Logic so I settled for comparing the last 7 days, to the previous 7 days and so on. Using the default timeslice would make the more recent chunk partial and worryingly low. I solved it like this:
| timeslice 1 buckets
| __timeslice_end+floor((__timeslice_end-_messagetime)/7d)*7d as _timeslice
| count_distinct(user) as sessions by _timeslice
In this case I can display the last 7 days in a counter on a dashboard with a sparkline to give a rough comparison over the past month.
Detecting Scheduled Searches
This one is even hackier but incredibly useful. Sumo Logic alerting only provides simple conditions based on the number of rows returned. This means that the best way to write alerts is to only return rows when there is a failed check and alert on the presence of any rows.
This works but is problematic for debugging. When you open the query you see nothing (if everything is healthy) and need to delete the filter row. If you forget to add the filter back you will constantly alert yourself. It would be nice if there was a built-in field for detecting that this is a scheduled alert however we can approximate that ourselves by detecting the window-length that the alert uses.
| timeslice 1 buckets
| __timeslice_end - _timeslice == 1h as is_scheudled_search
| where {{alert_condition}} || !is_scheudled_search
If you add the || condition to your filter it will always succeed if the window does not equal the scheduled search window. You can then save the search with a default window that isn’t the same as the scheduled search window so that by default you see all of the results.
It is also nice that this is also fail safe, if someone changes the scheduled search window you will get alerted, so that you know to put them back in sync.
